Latest Posts
Archives
|
 |
Explaining climate change science & rebutting global warming misinformation
Global warming is real and human-caused. It is leading to large-scale climate change. Under the guise of climate "skepticism", the public is bombarded with misinformation that casts doubt on the reality of human-caused global warming. This website gets skeptical about global warming "skepticism".
Our mission is simple: debunk climate misinformation by presenting peer-reviewed science and explaining the techniques of science denial, discourses of climate delay, and climate solutions denial.
Posted on 6 May 2024 by dana1981
This is a re-post from Yale Climate Connections

A farmworker cleans the solar panels of a solar water pump in the village of Jagadhri, Haryana Country, India. (Photo credit: Prashanth Vishwanathan/ IWMI)
Decisions made in India over the next few years will play a key role in global efforts to head off the most catastrophic effects of climate change.
The country has one of the world’s fastest-growing economies, and its energy consumption is growing rapidly as a result — but it still relies largely on fossil fuels. India has a general election that will wrap up in June 2024, and both major parties say they support moving the country away from fossil fuels as quickly as possible, a position backed by a sizable majority of citizens.
Global institutions like the International Monetary Fund and World Bank have pledged to help finance efforts to cut climate pollution. But many experts say more help is needed if India and other developing countries are to meet their energy goals.
As Indian Environment Secretary Rameshwar Prasad Gupta said in an interview with the Economic Times, “Without adequate climate finance being definitively available, we can’t commit” to curbing India’s carbon emissions fast enough to meet the country’s targets under the global Paris climate agreement of 2015.
How much does India contribute to climate change?
India has only generated about 3% of total historical climate pollution compared to 25% for the United States. But it is the third-highest carbon-polluting country today. To have a chance of meeting the Paris targets, the world cannot afford for India and other developing countries to follow the same path that made rich countries wealthy: burning “cheap” fossil fuels, because we now know the tremendous indirect costs of fossil fuel via environmental and health damages.
The size of India’s economy has almost doubled since Narendra Modi became prime minister a decade ago. The country surpassed China last year to become the most-populated country in the world with over 1.4 billion people. The number of Indians living in poverty has declined from 317 million in 2016 to 140 million today, although 90% of the population still lives on less than $10 per day.
With improved living conditions comes greater energy use and more pollution. India’s coal consumption has nearly tripled since 2005. India accounts for 14% of global coal demand, behind only China and is expected to account for most of the increase in global coal consumption in the coming years. India’s overall climate pollution is about 75% higher than in 2005, largely due to coal-fired power.
Still, although per-person carbon emissions in India have doubled since 2005, the average Indian’s carbon footprint remains less than half the world average and seven times lower than the average American’s.
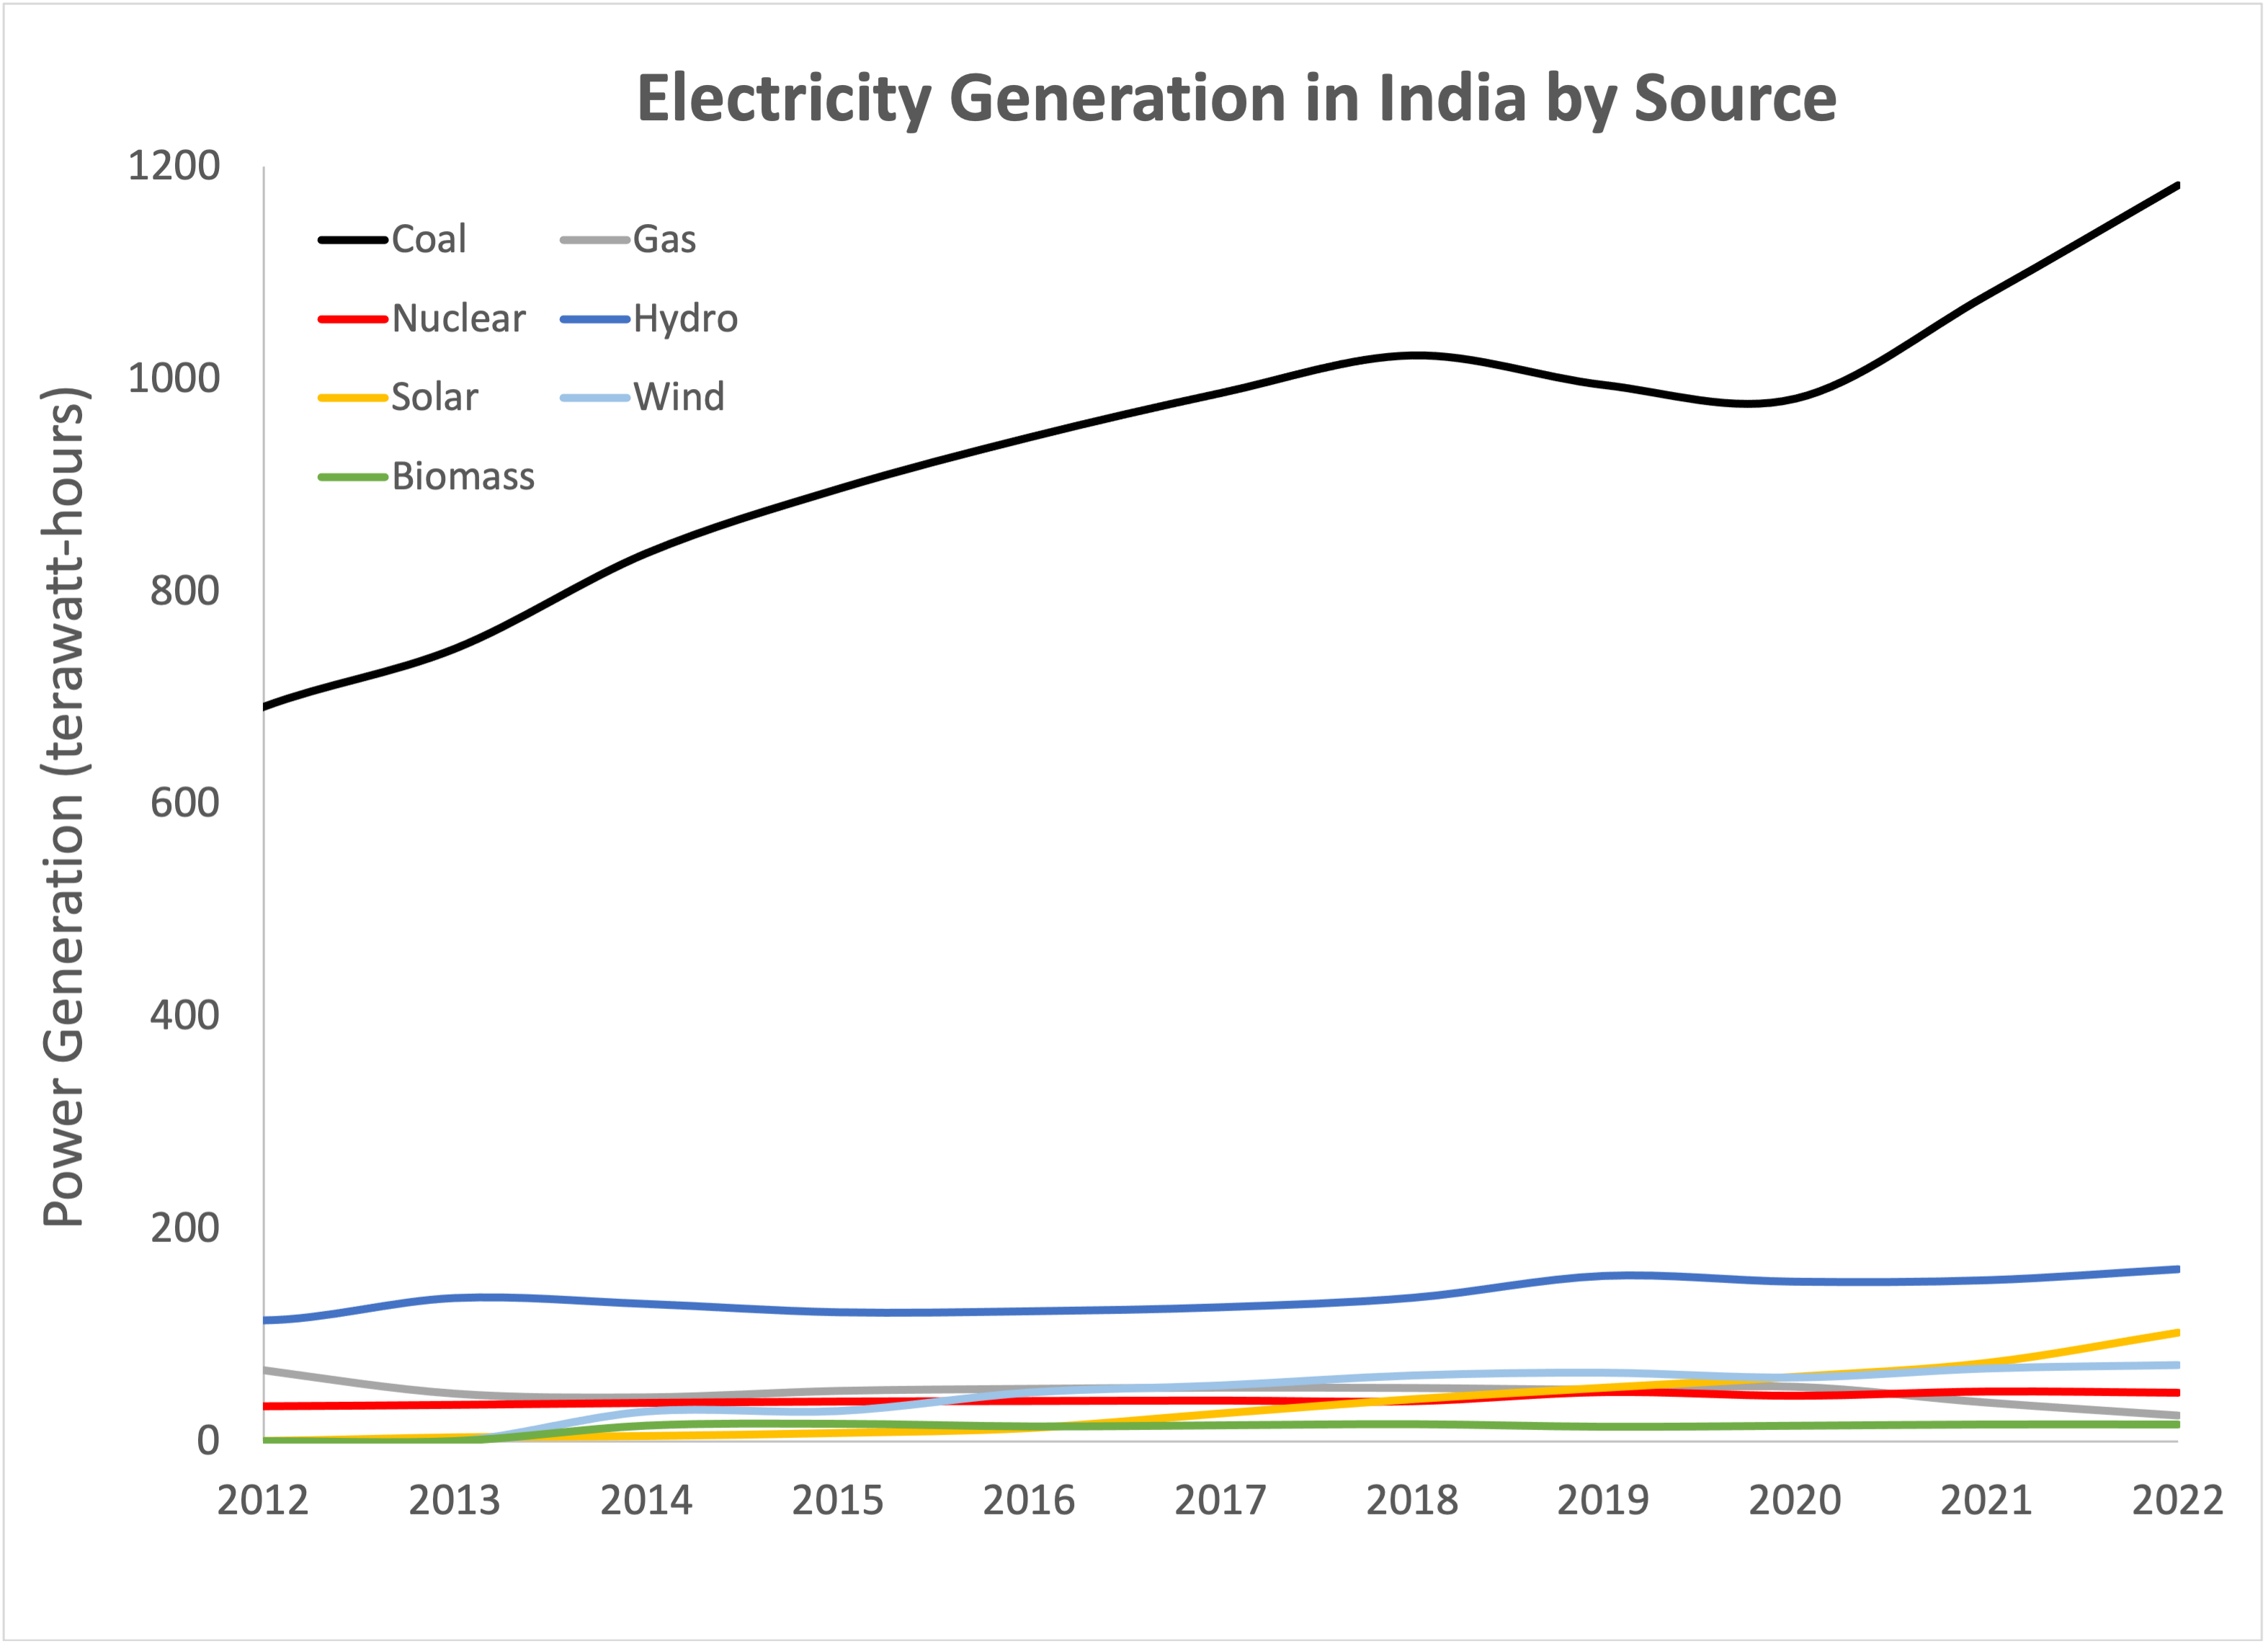 Sources of electricity generation in India. Created by Dana Nuccitelli with data from the government of India. Sources of electricity generation in India. Created by Dana Nuccitelli with data from the government of India.
Read more...
0 comments
Posted on 5 May 2024 by BaerbelW, Doug Bostrom, John Hartz
A listing of 26 news and opinion articles we found interesting and shared on social media during the past week: Sun, April 28, 2024 thru Sat, May 4, 2024.
Story of the week
"It’s straight out of Big Tobacco’s playbook. In fact, research by John Cook and his colleagues has shown that character assassination has been one of the most common ways in which fossil fuel interests have attempted to deny accountability for the climate crisis."
— Geoffrey Supan
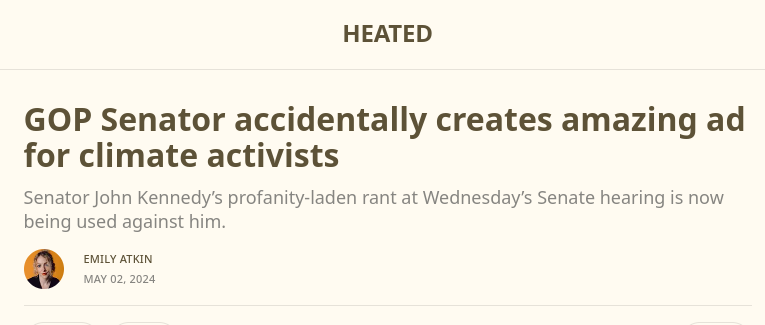 Why go low? Because when one can't fly, one creeps and crawls. Widely remarked: to fall back on ad hominem remarks is to declare intellectual surrender, at best a Hail Mary attempt to change topics— and easily spotted even by children arguing on a playground. "Going ad hom" is a common failure mode when talk turns to human-caused climate change. US Senator (from hydrocarbon-rich Louisiana) John Kennedy's waving the white flag and ceding a vast territory of evidence and facts to Geoffrey Supan by diving into the gutter is the subject of our story of the week. Kennedy humiliated himself in the most public of places: in a televised US Senate Budget Committee hearing. Why go low? Because when one can't fly, one creeps and crawls. Widely remarked: to fall back on ad hominem remarks is to declare intellectual surrender, at best a Hail Mary attempt to change topics— and easily spotted even by children arguing on a playground. "Going ad hom" is a common failure mode when talk turns to human-caused climate change. US Senator (from hydrocarbon-rich Louisiana) John Kennedy's waving the white flag and ceding a vast territory of evidence and facts to Geoffrey Supan by diving into the gutter is the subject of our story of the week. Kennedy humiliated himself in the most public of places: in a televised US Senate Budget Committee hearing.
In a nutshell, Senator Kennedy attempted to discredit Prof. Supan and divert attention from the content of Supan's testimony by highlighting a single social media item Supan had reposted, an innocuous description of tactical choices made by a youth-led climate action organization.This was thin fabric, comically so, and made worse by Kennedy's needing to read various expletives from other posts— unrelated to Supan's repost— into the congressional record.
Senator Kennedy's weird diversion encourages us to speculate— and legitimates scrutiny of Kennedy himself. With Kennedy's having created his own first mover disadvantage by changing the topic of the hearing from science to personalities, we are free in turn to wonder over his puzzling public messaging. Are we are seeing genuine inability to track a topic, or instead something more resembling a retail transaction? Emily Atkin's coverage in Heated tells the whole story and offers hints of where a parsimonious interpretation may lie.
Given Prof. Supan's testimony about the connection between fossil fuel industry contributions and politician support for industry agendas, a reasonable person reading this story must form their own conclusions over the root cause of Kennedy's rhetorical flop. One would think Senator Kennedy would understand how he was walking into a self-made trap of creating suspicions and doubts, issuing an unfavorable invitation to comparisons. After all, Kennedy was among the top four congressional recipients of fossil fuel industry campaign contributions for the 2022 election cycle. With money generally not being handed out in large quantities for zero consideration, one might see this as explanation for an otherwise curious choice to look foolish in front of the world.
As we can't read Senator Kennedy's mind, we are stuck with speculation. Is he only feigning incompetence? We can't truly know. It is of course for Senator Kennedy to choose how he leads our imaginations and is perceived— we can only respect his wishes, for bad or worse. If Kennedy wants to be remembered by history as "fond of loudly losing, but why?" who are we to question that?
Stories we promoted this week, by publication date:
Before April 28
April 28
Read more...
0 comments
Posted on 2 May 2024 by Doug Bostrom, Marc Kodack
Open access notables
Generative AI tools can enhance climate literacy but must be checked for biases and inaccuracies, Atkins et al., Communications Earth & Environment:
In the face of climate change, climate literacy is becoming increasingly important. With wide access to generative AI tools, such as OpenAI’s ChatGPT, we explore the potential of AI platforms for ordinary citizens asking climate literacy questions. Here, we focus on a global scale and collect responses from ChatGPT (GPT-3.5 and GPT-4) on climate change-related hazard prompts over multiple iterations by utilizing the OpenAI’s API and comparing the results with credible hazard risk indices. We find a general sense of agreement in comparisons and consistency in ChatGPT over the iterations. GPT-4 displayed fewer errors than GPT-3.5. Generative AI tools may be used in climate literacy, a timely topic of importance, but must be scrutinized for potential biases and inaccuracies moving forward and considered in a social context. Future work should identify and disseminate best practices for optimal use across various generative AI tools.
Astronomy’s climate emissions: Global travel to scientific meetings in 2019, Gokus et al., PNAS Nexus:
Travel to academic conferences—where international flights are the norm—is responsible for a sizeable fraction of the greenhouse gas (GHG) emissions associated with academic work. In order to provide a benchmark for comparison with other fields, as well as for future reduction strategies and assessments, we estimate the CO2-equivalent emissions for conference travel in the field of astronomy for the prepandemic year 2019. The GHG emission of the international astronomical community’s 362 conferences and schools in 2019 amounted to 42,500 tCO2e, assuming a radiative-forcing index factor of 1.95 for air travel. This equates to an average of 1.0 ± 0.6 tCO2e per participant per meeting. The total travel distance adds up to roughly 1.5 Astronomical Units, that is, 1.5 times the distance between the Earth and the Sun. We present scenarios for the reduction of this value, for instance with virtual conferencing or hub models, while still prioritizing the benefits conferences bring to the scientific community.
The IPCC’s reductive Common Era temperature history, Esper et al., Communications Earth & Environment:
Common Era temperature variability has been a prominent component in Intergovernmental Panel on Climate Change reports over the last several decades and was twice featured in their Summary for Policymakers. A single reconstruction of mean Northern Hemisphere temperature variability was first highlighted in the 2001 Summary for Policymakers, despite other estimates that existed at the time. Subsequent reports assessed many large-scale temperature reconstructions, but the entirety of Common Era temperature history in the most recent Sixth Assessment Report of the Intergovernmental Panel on Climate Change was restricted to a single estimate of mean annual global temperatures. We argue that this focus on a single reconstruction is an insufficient summary of our understanding of temperature variability over the Common Era. We provide a complementary perspective by offering an alternative assessment of the state of our understanding in high-resolution paleoclimatology for the Common Era and call for future reports to present a more accurate and comprehensive assessment of our knowledge about this important period of human and climate history.
Phasing out coal power in two major Southeast Asian thermal coal economies: Indonesia and Vietnam, Do & Burke, Energy for Sustainable Development:
The phase-out of unabated coal power is crucial for meeting climate agreements in coal-dependent economies such as Indonesia and Vietnam. Despite both countries committing to the 2021 Global Coal to Clean Power Transition Statement, translating phase-out pledges into action poses considerable challenges. Drawing insights from interviews with government, civil society, and industry experts, this study identifies the key barriers hindering coal phase-out in each country. Concerns about potentially escalating electricity prices and power shortages loom large, with the former being more prominent in Indonesia and the latter more prominent in Vietnam. The obstacles appear particularly significant in Indonesia for reasons including its higher coal dependence. We conclude that prioritizing renewable energy growth, as well as halting the construction of new coal plants, would be the most practical and viable way forward for both countries rather than an oversized early focus on coal plant closures. The analysis is of high relevance to informing plans under the two countries' Just Energy Transition Partnerships.
The decision maker’s lament: If I only had some science!, Bisbal, Ambio (perspective):
Environmental decision makers lament instances in which the lack of actionable science limits confident decision-making. Their reaction when the needed scientific information is of poor quality, uninformative, unintelligible, or altogether absent is often to criticize scientists, their work, or science in general. The considerations offered here encourage decision makers to explore alternative approaches to alleviate their disappointment. Ironically, many researchers lament the lack of support for the science they wish to deliver and accuse decision makers of failing to realize the value of the scientific studies they propose. Both communities would benefit by remembering that producing actionable science for a pending decision requires knowing the context for that decision beforehand. They may also look inward. Only then will they find answers to the question: What can I do within my own capacity to ensure that the necessary actionable science becomes available and facilitate its use to inform decisions?
From this week's government/NGO section
Heavy precipitation hitting vulnerable communities in the UAE and Oman becoming an increasing threat as the climate warms, Zachariah et al., World Weather Attribution:
From April 14 to 15 2024, the United Arab Emirates (UAE) and the northern parts of Oman were hit by exceptionally heavy rainfall causing massive disruption in infrastructure and public life in the area and leading to at least 20 fatalities in Oman and four in the United Arab Emirates UAE. The disagreement between model results and observations prevents the authors from concluding with certainty that human-induced climate change is the main driver making this event more likely. However, while multiple reasons could explain the absence of a trend in the model results, the authors have no alternative explanation for a trend in observations other than the expectation of heavy rainfall increasing in a warmer climate.
Climate Reality on-Screen: The Climate Crisis in Popular Films, 2013-22, Schneider-Mayerson, et al., Buck Lab for Climate and Environment, Colby College:
The authors provide audience members, screenwriters, filmmakers, studios, and researchers with a straightforward way to evaluate whether climate change is represented—or omitted—in any narrative through a two-part, binary evaluation tool that is simple, illuminating, and powerful.
140 articles in 64 journals by 910 contributing authors
Physical science of climate change, effects
Asymmetric impacts of forest gain and loss on tropical land surface temperature, Zhang et al., Nature Geoscience 10.1038/s41561-024-01423-3
Carbon budget concept and its deviation through the pulse response lens, Avakumovi?, Earth System Dynamics Open Access 10.5194/esd-15-387-2024
Observations of climate change, effects
Anthropogenic influence on seasonal extreme temperatures in eastern China at century scale, Hu et al., Weather and Climate Extremes Open Access 10.1016/j.wace.2024.100675
Read more...
0 comments
Posted on 30 April 2024 by John Mason, BaerbelW
On February 14, 2023 we announced our Rebuttal Update Project. This included an ask for feedback about the added "At a glance" section in the updated basic rebuttal versions. This weekly blog post series highlights this new section of one of the updated basic rebuttal versions and serves as a "bump" for our ask. This week features "Clearing up misconceptions regarding 'hide the decline'". More will follow in the upcoming weeks. Please follow the Further Reading link at the bottom to read the full rebuttal and to join the discussion in the comment thread there.
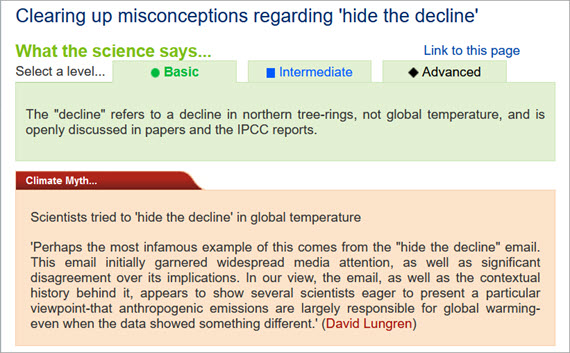
At a glance
It's been many years since 'climategate' - when in 2009, the email server at the Climate Research Unit, University of East Anglia, was hacked. The unidentified hacker helped themselves to thousands of emails. These were sifted through and a selection was in due course made available for public download on a Russian server.
What followed was typical of the tactics used in the campaign to deny the existence of human-caused climate change and is illustrative for that reason. A lot of this manufactured controversy centred on one email, written by Dr Phil Jones, in which the following sentence was picked out and trumpeted all over the media:
"I've just completed Mike's Nature trick of adding in the real temps to each series for the last 20 years (ie from 1981 onwards) and from 1961 for Keith's to hide the decline."
"Gotcha!", the deniers proclaimed.
Climategate was marketed to the public by encouraging them to take such sentences at face value - without any idea of what they actually meant. The notion being planted was that climate scientists were busy covering up declining temperatures.
It meant nothing of the sort. The people in that email were not talking about temperatures. They were talking about tree-rings.
"Mike's Nature trick" referred to a technique described in a 1998 Nature paper. The paper presented a 600 year-long global temperature reconstruction by Michael Mann and colleagues. Michael has long used tree-ring growth patterns in ancient wood to reconstruct conditions at the time those rings formed. The basic idea is that in cold, dry years, trees grow more slowly so their rings are relatively narrow and densely-spaced. In warm wet years, it's the opposite.
The "trick" is the technique of plotting recent instrumental data - in other words direct temperature measurements - alongside the reconstructed tree-ring data for the time they overlap. Why? Because it's one way of checking if the reconstructed tree-ring data are a good proxy for temperatures of the past. It therefore makes entire sense to run such checks. Now to the 'decline'. What declined?
Beyond a certain point on the timeline, around 1960, the temperature reconstructions based on some tree-ring data fell away and downwards from observed thermometer records. They declined from reality. This only happened with certain tree-ring datasets from specific places. Known as the 'divergence problem', it had been discussed in the scientific literature since the mid 1990s - 15 years before 'climategate'. However, not a lot of people realised that. How lucky for the deniers. "Hide the decline!", they chanted feverishly, to anybody who would listen.
Everything that occurs in the physical world has a cause. The divergence of temperature reconstructions, based on tree-ring growth, from the observational temperature record is a case in point. The loss of tree-ring sensitivity to temperatures kicked in around 1960. It only affected certain tree-species at certain locations. However, in those cases the post-1960 tree-ring datasets do not reflect the actual conditions. In other words, the data are useless. That's the decline for you. Much ado about nothing.
Please use this form to provide feedback about this new "At a glance" section. Read a more technical version below or dig deeper via the tabs above!
Read more...
1 comments
Posted on 29 April 2024 by Guest Author
This is a re-post from The Climate Brink by Andrew Dessler
In the wake of any unusual weather event, someone inevitably asks, “Did climate change cause this?” In the most literal sense, that answer is almost always no. Climate change is never the sole cause of hurricanes, heat waves, droughts, or any other disaster, because weather variability always plays a primary role in the genesis of the events.
However, climate change can make these events more intense and, given the non-linearities in the damages, this can vastly increase the damage and misery from extreme weather. So quantifying the role of climate change is therefore of great interest.
To do this, scientists turn to extreme event attribution studies. These rely on three separate lines of evidence. The first is the observational record: If you have good observations of the climate over a long enough period, the data set can be statistically analyzed to determine whether the event in question is becoming more frequent as the climate warms.
Read more...
5 comments
Posted on 28 April 2024 by BaerbelW, Doug Bostrom, John Hartz
A listing of 31 news and opinion articles we found interesting and shared on social media during the past week: Sun, April 21, 2024 thru Sat, April 27, 2024.
Story of the week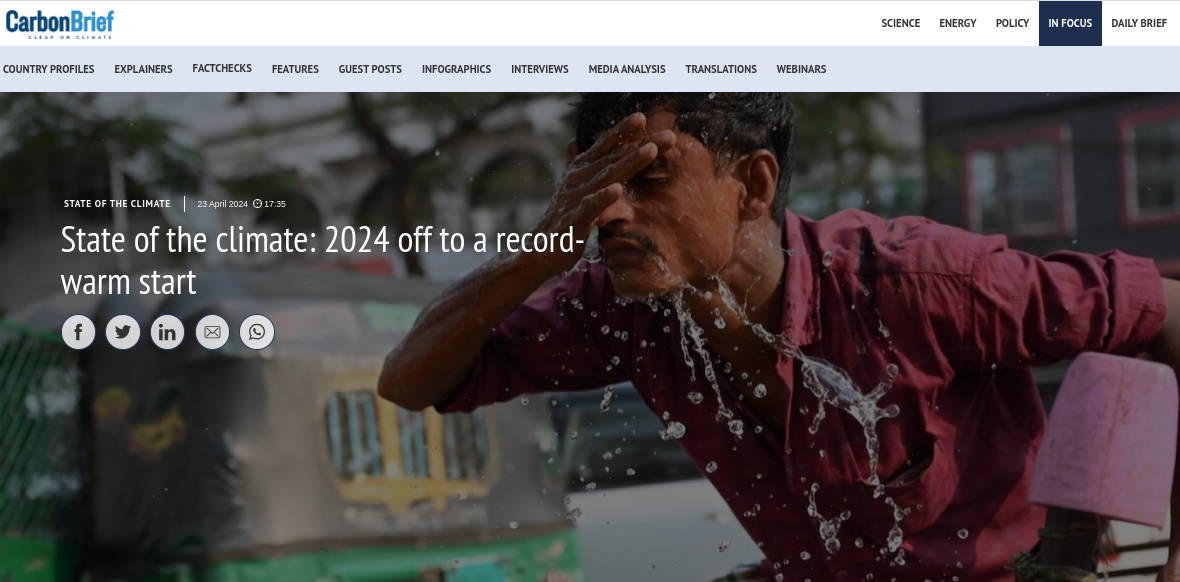
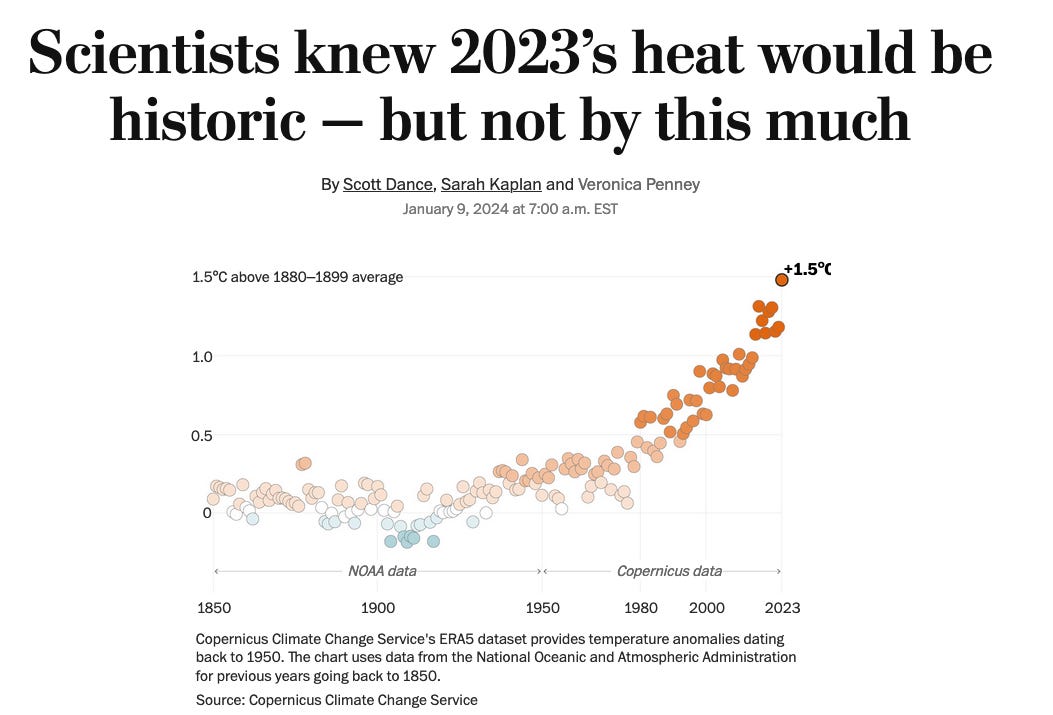
Anthropogenic climate change may be the ultimate shaggy dog story— but with a twist, because here endless subplots definitely depend upon one central element in the unfolding drama of our grand physics accident: the dominant story mechanic is that we're changing Earth's climate. This leads to outcomes. One way of seeing this is via the abstraction of statistics, while another perspective is that of individual experiences each of which is only an anecdote but together lead us back to statistics. Our story of the week is Carbon Brief's annual summary State of the climate: 2024 off to a record-warm start:
This year is shaping up to either match or surpass 2023 as the hottest year on record.
Global temperatures have been exceptionally high over the past three months – at around 1.6C above pre-industrial levels – following the peak of current El Niño event at the start of 2024.
The past 10 months have all set new all-time monthly temperature records, though the margin by which new records have been set has fallen from around 0.3C last year to 0.1C over the first three months of 2024.
April 2024 is on track to extend this streak to 11 record months in a row.
Author Zeke Hausfather continues this informative summary by delivering a complete numerical rundown of where we stand with regard to global surface temperature. In sum we're we're living a spike. Our shock is belated. Expert opinion suggests we're experiencing another wiggle in a upward-trending graph. We've seen this before in historical records, only less remarked given we're only now having our first brush with 1.5 °C of overall warming. In any case, the directed herky jerky plot of global warming inevitably unfolds a bevy of subplots exemplified by other stories from this week's roundup, "anecdotes" in the grand scheme of global temperature records:
This shaggy dog story will continue to proliferate and evolve while we wait to reach our next record year.
Stories we promoted this week, by publication date:
Before April 21
- Climate change is also a chance to transform education in America - again, TheHill, Andrés Henríquez.
- The big dry: forests and shrublands are dying in parched Western Australia, Environment & Energy, The Conversation AU, by Joe Fontaine, George Matusick, Jatin Kala, Kerryn Hawke & Nate Anderson.
- A Planetary Crisis Awaits the Next President, New York Times, Guest Essay by Stephen Markley.
April 21
Read more...
0 comments
Posted on 27 April 2024 by SkS-Team
 Skeptical Science is partnering with Gigafact to produce fact briefs — bite-sized fact checks of trending claims. This fact brief was written by Sue Bin Park in collaboration with members from our Skeptical Science team. You can submit claims you think need checking via the tipline. Skeptical Science is partnering with Gigafact to produce fact briefs — bite-sized fact checks of trending claims. This fact brief was written by Sue Bin Park in collaboration with members from our Skeptical Science team. You can submit claims you think need checking via the tipline.
Is Antarctica gaining land ice?
 While Antarctic sea ice varies seasonally, the continent's land ice has continued to melt at an increasing pace. While Antarctic sea ice varies seasonally, the continent's land ice has continued to melt at an increasing pace.
Sea ice forms during the Antarctic winter and retreats during the warmer months. Such freeze-thaw cycles have no impact on sea levels since they happen within the ocean. However, Antarctic land ice has seen a net decrease, resulting in a significant increase in fresh water flowing into the sea. That does affect global sea levels.
The behavior of Antarctic land ice varies from region to region. In particular, the West Antarctic Peninsula has seen drastic ice retreat. On the other hand, East Antarctica's land ice has remained relatively stable to date. But if global warming crosses a specific threshold, serious loss is expected to occur. The planet has already moved a third of the way towards that threshold and will pass it within a century, if fossil fuel burning continues unabated.
Go to full rebuttal on Skeptical Science or to the fact brief on Gigafact
This fact brief is responsive to conversations such as this one.
Sources
Read more...
0 comments
Posted on 26 April 2024 by BaerbelW, John Cook, John Mason
This video includes conclusions of the creator climate scientist Dr. Simon Clark. It is presented to our readers as an informed perspective. Please see video description for references (if any).
This year you will be lied to! Simon Clark helps prebunk some misleading statements you'll hear about climate. The video includes a few interview snippets with John Cook and John Mason while a longer version of the interview is available on subscription based Nebula.
Support Simon Clark on patreon: https://patreon.com/simonoxfphys
Read more...
14 comments
Posted on 25 April 2024 by Doug Bostrom, Marc Kodack
Open access notables
Ice acceleration and rotation in the Greenland Ice Sheet interior in recent decades, Løkkegaard et al., Communications Earth & Environment:
In the past two decades, mass loss from the Greenland ice sheet has accelerated, partly due to the speedup of glaciers. However, uncertainty in speed derived from satellite products hampers the detection of inland changes. In-situ measurements using stake surveys or GPS have lower uncertainties. To detect inland changes, we repeated in-situ measurements of ice-sheet surface velocities at 11 historical locations first measured in 1959, located upstream of Jakobshavn Isbræ, west Greenland. Here, we show ice velocities have increased by 5–15% across all deep inland sites. Several sites show a northward deflection of 3–4.5° in their flow azimuth. The recent appearance of a network of large transverse surface crevasses, bisecting historical overland traverse routes, may indicate a fundamental shift in local ice dynamics. We suggest that creep instability—a coincident warming and softening of near-bed ice layers—may explain recent acceleration and rotation, in the absence of an appreciable change in local driving stress.
Record-breaking fire weather in North America in 2021 was initiated by the Pacific northwest heat dome, Jain et al., Communications Earth & Environment:
The 2021 North American wildfire season was marked by record breaking fire-conducive weather and widespread synchronous burning, extreme fire behaviour, smoke and evacuations. Relative to 1979–2021, the greatest number of temperature and vapor pressure deficit records were broken in 2021, and in July alone, 3.2 million hectares burned in Canada and the United States. These events were catalyzed by an intense heat dome that formed in late June over western North America that synchronized fire danger, challenging fire suppression efforts. Based on analysis of persistent positive anomalies of geopotential heights, the heat dome accounted for 21–34% of the total area burned in 2021. The event was 59% longer, 34% larger and had 6% higher maximum amplitude than the same event would have been without a warming climate. Climate change will continue to magnify heat dome events, increase fire danger, and enable extreme synchronous wildfire in forested areas of North America.
Future Slower Reduction of Anthropogenic Aerosols Enhances Extratropical Ocean Surface Warming Trends, Gu et al., Geophysical Research Letters:
Global surface temperature short-term trends fluctuate between cooling and fast-warming under the combined action of external forcing and internal variability, significantly influencing the detectability of near-term climate change. A key driver of these variations is anthropogenic aerosols (AAs), which have undergone a non-monotonic evolution with rapid reduction in recent decades. However, their reduction is projected to decelerate under a high carbon emission scenario, yet the impact on surface temperature trends remains unknown. Here, using initial-perturbation large ensembles, we find that future slowdown in AA reduction over Europe and North America expedites the subpolar North Atlantic surface warming by intensifying the Atlantic meridional overturning circulation. Further, it accelerates the South Indian Ocean and Southern Ocean surface warming through positive low-cloud feedback and oceanic dynamical adjustment, triggered by the poleward migration of westerlies under interhemispheric energy constraint. These AA-driven warmings exacerbate greenhouse warming, significantly enhancing the detectability of local decadal warming trends.
Deglacial Pulse of Neutralized Carbon From the Pacific Seafloor: A Natural Analog for Ocean Alkalinity Enhancement?, Green et al., Geophysical Research Letters:
The ocean carbon reservoir controls atmospheric carbon dioxide (CO2) on millennial timescales. Radiocarbon (14C) anomalies in eastern North Pacific sediments suggest a significant release of geologic 14C-free carbon at the end of the last ice age but without evidence of ocean acidification. Using inverse carbon cycle modeling optimized with reconstructed atmospheric CO2 and 14C/C, we develop first-order constraints on geologic carbon and alkalinity release over the last 17.5 thousand years. We construct scenarios allowing the release of 850–2,400 Pg C, with a maximum release rate of 1.3 Pg C yr−1, all of which require an approximate equimolar alkalinity release. These neutralized carbon addition scenarios have minimal impacts on the simulated marine carbon cycle and atmospheric CO2, thereby demonstrating safe and effective ocean carbon storage. This deglacial phenomenon could serve as a natural analog to the successful implementation of gigaton-scale ocean alkalinity enhancement, a promising marine carbon dioxide removal method.
From this week's government/NGO section:
Climate Impact of Primary Plastic Production, Karali et al., Lawrence Berkeley National Laboratory:
Plastics show the strongest production growth of all bulk materials over the last decade. The industry’s current growth trajectory is exponential and plastic production is expected to double or triple by 2050. The rapidly increasing production of plastics and the continued reliance on fossil fuels for production, have contributed to numerous environmental problems and health harms. As a result, plastic pollution has become an increasing threat to natural ecosystems, human health and climate. However, there is a lack of granularity on the contribution of the primary plastics specifically to greenhouse gas (GHG) emissions and their impact on the remaining global carbon budget needed to stay below a 1.5°C or 2°C global average temperature rise. The authors explore the contribution of primary plastic production to climate change disaggregated by polymer and technology.
The Elephant in the Climate Room: Financing Sustainable Security and Supporting Future-Fit Systems, Cicarelli et al., The Center for Climate and Security:
The authors outline the key challenges facing policymakers ahead of this year's "Spring Meetings" of the International Monetary Fund and World Bank, particularly in the context of food security challenges, global instability, and gaps in climate finance. The gap in climate finance has implications beyond sustainable development and humanitarian needs. Further, investments in climate adaptation and resilience are essential for addressing the security implications of climate change, helping reduce risks and vulnerabilities, and helping build more stable and secure societies.
129 articles in 64 journals by 682 contributing authors
Physical science of climate change, effects
Absorption of Solar Radiation by Noctilucent Clouds in a Changing Climate, Lübken et al., Geophysical Research Letters Open Access pdf 10.1029/2023gl107334
Hydrologic cycle weakening in hothouse climates, Liu et al., Science Advances 10.1126/sciadv.ado2515
Read more...
0 comments
Posted on 24 April 2024 by Guest Author
This is a re-post from Yale Climate Connections by Megan Valére Sosou
 Market gardening site of the Itchèléré de Itagui agricultural cooperative in Dassa-Zoumè (Image credit: Megan Valère Sossou) Market gardening site of the Itchèléré de Itagui agricultural cooperative in Dassa-Zoumè (Image credit: Megan Valère Sossou)
For the residents of Dassa-Zoumè, a city in the West African country of Benin, choosing between drinking water and having enough food has become a worrying dilemma.
“Last year, our horticultural production plummeted due to water scarcity,” said Chantal Agbangla, a farmer residing in Soclogbo, a town located about 30 minutes by car from the capital of Dassa-Zoumé. “We had to travel nine kilometers to find water, mainly for our agricultural and domestic needs.”
Family farming, a pillar of the economy in Dassa-Zoumè, is more threatened than ever by climate change. Small-scale farms cover only about 2% of cultivable land in the area of Dassa-Zoumé, and their very survival seems threatened because water has become an increasingly precious commodity. Residents can no longer rely on the rainy season, as the irregularity of precipitation has made it an unreliable water source. Instead, they have embraced agroecological horticulture as a contingency plan against climate change. Agroecology emphasizes sustainable farming practices that prioritize water retention in the soil, making this type of farming more resistant to drought.
Read more...
0 comments
Posted on 23 April 2024 by John Mason, BaerbelW
On February 14, 2023 we announced our Rebuttal Update Project. This included an ask for feedback about the added "At a glance" section in the updated basic rebuttal versions. This weekly blog post series highlights this new section of one of the updated basic rebuttal versions and serves as a "bump" for our ask. This week features "The difference between weather and climate". More will follow in the upcoming weeks. Please follow the Further Reading link at the bottom to read the full rebuttal and to join the discussion in the comment thread there.
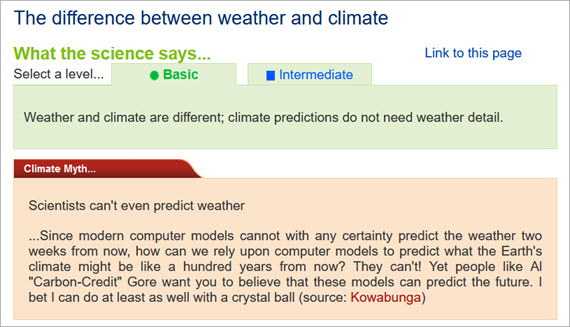
At a glance
How do you go about weather forecasting by yourself? Study the computer models. With experience, you will become familiar with the art - for it takes human interpretation of model output to make the calls. That's what weathermen do.
Forecast model output is freely available online and covers many parameters - pressure, temperature, rainfall and a myriad of others. Different models extend to different end-times - the Global Forecasting System (GFS) extends to T+ 384 hours or 16 days, for example. Pressure, or synoptic charts as they are known, portray the positions and subsequent developments of high and low pressure systems over large swathes of the planet.
Models are run several times a day. If you examine synoptic charts for the same run of several different models, you will see they all look very similar to start with. But if you then follow them through successive time-points - T+24, 48, 72 hours and so on, there will come a point where you start to notice slight and then larger differences between them. This divergence is where confidence in forecasting falls right away.
Forecasting - interpreting the GFS and other model output - is about working with uncertainty in the highly dynamic and to an extent chaotic medium that is our atmosphere. But with experience, you can do your own short term forecasting too, at least for the coming 3-5 days.
Longer-term weather forecasting a week or more in advance is about stating probabilities, not saying what will happen. Very different things. Serious amateur forecasters stick to the shorter, next few days bracket, if they want to avoid egg on their faces. There are a few out there who often make wild claims that usually fail to be borne out by reality. Unfortunately, sections of the more populist media happily quote them. It generates click-baity headlines.
Now, what about climate? Climate differs from weather because it includes certain highly deterministic drivers. Deterministic means they evolve independently of weather but can change the physical conditions on Earth from state A to state B. Cyclic variations in Earth's orbit of the Sun, operating over tens of thousands of years, are a good example. They may only drive average planetary temperature changes of a few degrees Celsius, upwards or downwards. But with the help of climate feedbacks, that is enough to have caused past ice-ages - and to have gotten us out of them again.
Changes in the strength of Earth's greenhouse effect are likewise deterministic, but to a far greater extent. They have forced past transitions from the Hothouse to the Icehouse climate state. Hothouse, by the way, is an ice-free Earth. Because we know how the greenhouse effect works, we can say with confidence that intensifying its strength will cause global temperatures to rise over centuries. What we cannot say is what weather will occur on a certain day at a certain place, decades from now. But there's a handy saying to cover that: "climate trains the boxer, but the weather throws the punches". (Deke Arndt, Climate Monitoring Branch Chief, NCDC, 2010)
Please use this form to provide feedback about this new "At a glance" section. Read a more technical version below or dig deeper via the tabs above!
Read more...
0 comments
Posted on 22 April 2024 by Guest Author
This is a re-post from Yale Climate Connections by Sarah Spengeman
 People wait to board an electric bus in Pune, India. (Image credit: courtesy of ITDP) People wait to board an electric bus in Pune, India. (Image credit: courtesy of ITDP)
Public transportation riders in Pune, India, love the city’s new electric buses so much they will actually skip an older diesel bus that arrives earlier to wait for a smoother, cooler ride in a new model. This has fed a new problem: overcrowding. Fortunately, more new buses are on the way.
Last fall, India’s Ministry of Housing and Urban Affairs launched a $7 billion initiative to support 10,000 new electric buses in 169 Indian cities. The PM-eBus Sewa program prioritizes small to medium-sized cities of up to 4 million people, particularly those now lacking organized bus service. India hopes this will make public transport — not private vehicles — integral to sustainable urban growth and city culture in the country that last year overtook China to become the world’s most populous nation.
India’s burgeoning cities are expected to be home to an estimated 416 million more people by 2050 — the largest urban increase in the world. Massive growth could worsen both traffic congestion and air quality in a country that already has nine of the 10 most polluted cities on the planet and ranks second in deaths related to transportation pollution.
But more traffic and pollution is not inevitable, since India has yet to build 70 to 80% of city infrastructure that will be needed by 2050. The government initiative aims to make clean, electrified public transportation the norm.
PM-eBus Sewa (Sewa means “service” in Hindi) will also invest in infrastructure like bus depots, interchange facilities, advanced fare collection systems, and fleet charging facilities. New, holistic transport systems in these rapidly developing cities will also create economic opportunities, giving all residents access to affordable, reliable transportation to travel to work or school.
Electric buses require a larger upfront investment even though they are cheaper than diesel buses over their lifetimes due to lower fuel and maintenance costs. Therefore, PM-eBus Sewa will focus on smaller cities with fewer financial resources. It also will use an innovative funding mechanism called a gross cost contract model, which has already succeeded in several Indian cities. The local transportation authority contracts with a private company that owns the bus, often the manufacturer, to operate the bus and handle maintenance, charging, and staffing over a set time period. This allows cities to pay for buses over a longer term rather than all at once.
“India’s cities do want to run bus services but do not have funds for sustained bus operations,” explained Surendra Kumar Bagde, additional secretary, Ministry of Housing and Urban Affairs at the International Council on Clean Transportation’s Clean Transport Summit in New Delhi last August. “PM-ebus Sewa gives this sustained bus operations support.”
Read more...
0 comments
Posted on 21 April 2024 by BaerbelW, Doug Bostrom, John Hartz
A listing of 29 news and opinion articles we found interesting and shared on social media during the past week: Sun, April 14, 2024 thru Sat, April 20, 2024.
Story of the week
Our story of the week hinges on these words from the abstract of a fresh academic publication:
Here we use recent empirical findings from more than 1,600 regions worldwide over the past 40 years to project sub-national damages from temperature and precipitation, including daily variability and extremes7,8. Using an empirical approach that provides a robust lower bound on the persistence of impacts on economic growth, we find that the world economy is committed to an income reduction of 19% within the next 26 years independent of future emission choices (relative to a baseline without climate impacts, likely range of 11–29% accounting for physical climate and empirical uncertainty). These damages already outweigh the mitigation costs required to limit global warming to 2 °C by sixfold over this near-term time frame and thereafter diverge strongly dependent on emission choices.
That dry language and the arc of the authors' research findings unpacks as evidence-based headlines:
The paper's results will be refined, inevitably. With passing time the empirical, already-experienced evidence the paper relies upon to establish its projections will increasingly include measurable economic impact. Meanwhile other researchers will doubtless be inspired to improve on this effort, "what if the authors are incorrect?" being a reasonable question to ask. Equally it's reasonable to ask "how wrong can they be?" Even supposing that the unfolding truth reveals the authors have delivered a 50% overshoot, 19 trillion dollars is not a trivial amount of economic opportunity to lose. Our ultimate truth may also include underestimation. For the time being, Stanford University's Marshall Burke may have the best assessment of this paper, for guiding our path forward: "I wouldn’t put a ton of weight on their specific numerical estimates, but I think the big picture is basically right." Marshall seems suitably cautious; when starting at $38T/year, plus or minus a lot still ends up as a big deal. The big picture includes that we have other urgent needs for funds on this scale and can't afford accidental (or intentional) wasted opportunity costs of this magnitude. Procrastination on dealing with our climate problem loses us important options.
Stories we promoted this week, by publication date:
Before April 14
- Shell says it `lobbies for energy transition` during climate ruling appeal, The Guardian, Ajit Niranjan. Company is fighting Dutch court ruling that says it must emit 45% less CO2 by 2030 than in 2019
- Jail for holding a placard? Protest over the climate crisis is being brutally suppressed | Natasha Walter, The Guardian, Natasha Walter. The legal repression of activism has been fast and frightening, yet it won’t make protesters disappear and only sows division
- Review of Climate: The Movie (The Cold Truth) reveals numerous, well-known misinformation talking points and inaccuracies, Science Feedback, Darrik Burns (Editor).
- Trump allies target NOAA climate research, E&E News, Scott Waldmann. A planning document for a second Trump administration also recommends the National Weather Service commercialize its forecasting operations.
- Brazil’s cattle industry could suffer major losses without climate policies, report says, Mongabay, Maxwell Radwin.
Read more...
2 comments
Posted on 19 April 2024 by BaerbelW
Note: this blog post has been put together over the course of the week I followed the happenings at the conference virtually. Should recordings of the Great Debates and possibly Union Symposia mentioned below, be released sometime after the conference ends, I'll include links to the ones I participated in.
This year's General Assembly of the European Geosciences Union (EGU) started on Monday April 15 both on premise in Vienna and online as a fully hybrid conference. This year, I decided to join virtually for the whole week, picking and chosing sessions I was interested in. At the time of publication this blog post was still an evolving compilation - a kind of personal diary - of the happenings from my perspective.
As this post will get fairly large, you can jump to the different days, via these links (bolded days have been added already):
Monday - Tuesday - Wednesday - Thursday - Friday

The already published prolog blog post contains general explanations about the session formats as well as my planned itinerary for the week.
Monday, April 15
EGU Today
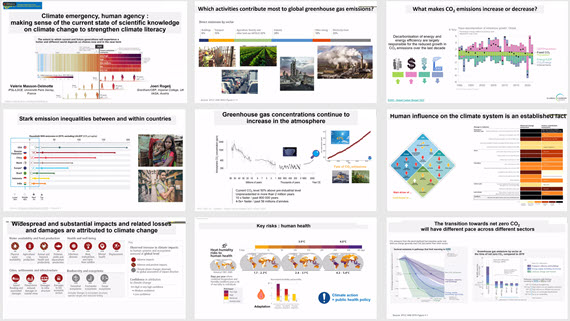
My week started at 8:30 in the morning with Union Symposia (US2) about the Climate emergency, human agency: making sense of the current state of scientific knowledge on climate change to strengthen climate literacy.
This Union Symposium will build on key findings from the Sixth Assessment Cycle of the Intergovernmental Panel on Climate Change (IPCC). It will place the current scientific understanding in this context of climate science history and lay out what is the current state of climate, with the observed intensification of global and regional changes, and what are physically plausible futures, unpacking how science underpins the understanding of the climate emergency. The presentations will be given by Valérie Masson-Delmotte, Laboratoire des Sciences du Climat et de l'Environnement, IPSL, France and Joeri Rogelj, Centre for Environmental Policy, Imperial College, London, Great Britain.
This symposia was a great start into the week as the presentation jointly given by Valérie Masson-Delmotte amd Joeri Rogelj was very rich in information and contained lots of neat slides walking us through some basics of climate science and what those mean moving forward. The session was part of the climate literacy initiative and 50 students and their teachers from Vienna schools had been invited to join it so that they had a chance to experience a scientific conference directly. Throughout the presentation, it was made clear that the climate crisis is an intergenerational justice as well as a public health issue. This composite image gives just a little glimpse of the many neat slides included (click to enlarge):
Afterwards, I joined a short course (SC2.2) providing an introduction to science for policy. Even though this was a repeat for me, I found this session - convended by Chloe Hill - interesting again.
Read more...
0 comments
Posted on 18 April 2024 by Doug Bostrom, Marc Kodack
Open access notables
Glacial isostatic adjustment reduces past and future Arctic subsea permafrost, Creel et al., Nature Communications:
Sea-level rise submerges terrestrial permafrost in the Arctic, turning it into subsea permafrost. Subsea permafrost underlies ~ 1.8 million km2 of Arctic continental shelf, with thicknesses in places exceeding 700 m. Sea-level variations over glacial-interglacial cycles control subsea permafrost distribution and thickness, yet no permafrost model has accounted for glacial isostatic adjustment (GIA), which deviates local sea level from the global mean due to changes in ice and ocean loading. Here we incorporate GIA into a pan-Arctic model of subsea permafrost over the last 400,000 years. Including GIA significantly reduces present-day subsea permafrost thickness, chiefly because of hydro-isostatic effects as well as deformation related to Northern Hemisphere ice sheets. Additionally, we extend the simulation 1000 years into the future for emissions scenarios outlined in the Intergovernmental Panel on Climate Change’s sixth assessment report. We find that subsea permafrost is preserved under a low emissions scenario but mostly disappears under a high emissions scenario.
How do we reinforce climate action?, Zhao et al., Sustainability Science:
Humanity has a shrinking window to drastically reduce greenhouse gas emissions, yet climate action is still lacking on both individual and policy levels. We argue that this is because behavioral interventions have largely neglected the basic principles of operant conditioning as one set of tools to promote collective climate action. In this perspective, we propose an operant conditioning framework that uses rewards and punishments to shape transportation, food, waste, housing, and civic actions. This framework highlights the value of reinforcement in encouraging the switch to low-emission behavior, while also considering the benefit of decreasing high-emission behavior to expedite the transition. This approach also helps explain positive and negative spillovers from behavioral interventions.
Climate change-driven cooling can kill marine megafauna at their distributional limits, Lubitz et al., Nature Climate Change:
The impacts on marine species from secular warming and heatwaves are well demonstrated; however, the impacts of extreme cold events are poorly understood. Here we link the death of organisms from 81 species to an intense cold upwelling event in the Agulhas Current, and show trends of increasing frequency and intensification of upwelling in the Agulhas Current and East Australian Current. Using electronic tagging, we illustrate the potential impacts of upwelling events on the movement behaviour of bull sharks Carcharhinus leucas, including alterations of migratory patterns and maintenance of shallower dive profiles when transiting through upwelling cells. Increasing upwelling could result in ‘bait and switch’ situations, where climate change expands subtropical species’ distribution, while simultaneously exposing climate migrants to an increased risk of cold-mortality events at poleward distributional limits. This shows the potential impacts of increased cold events, an understudied aspect of climate change research, and highlights the complexities of climate change effects on marine ecosystems.
Literature-informed likelihoods of future emissions and temperatures, Venmans & Carr, Climate Risk Management:
How high should we build a dyke today, knowing that it will serve for more than 50 years? This depends on the probability distribution of future temperatures. We review the literature on estimates of future emissions for current/stated policy scenarios and current pledge scenarios. Reviewing expert elicitations, abatement costs of scenarios, learning rates of technologies, fossil fuel supply side dynamics and geoengineering, we argue that scenarios with emissions largely beyond current/stated policy scenarios and largely below current pledge scenarios are relatively unlikely. Based on this, we develop a literature-informed evaluation of the likelihoods of future temperature for use in Value at Risk stress tests in 2030, 2050 and 2100.
Climate damage projections beyond annual temperature, Waidelich et al., Nature Climate Change:
Estimates of global economic damage from climate change assess the effect of annual temperature changes. However, the roles of precipitation, temperature variability and extreme events are not yet known. Here, by combining projections of climate models with empirical dose–response functions translating shifts in temperature means and variability, rainfall patterns and extreme precipitation into economic damage, we show that at +3 °C global average losses reach 10% of gross domestic product, with worst effects (up to 17%) in poorer, low-latitude countries. Relative to annual temperature damage, the additional impacts of projecting variability and extremes are smaller and dominated by interannual variability, especially at lower latitudes. However, accounting for variability and extremes when estimating the temperature dose–response function raises global economic losses by nearly two percentage points and exacerbates economic tail risks.
From this week's government/NGO section:
Boom and Bust Coal. Tracking the Global Coal Plant Pipeline, Global Energy Monitor, Global Energy Monitor, CREA, E3G, Reclaim Finance, Sierra Club, SFOC, Kiko Network, CAN Europe, Bangladesh Groups, Trend Asia, Alliance for Climate Justice and Clean Energy, Chile Sustentable, POLEN Transiciones Justas, Iniciativa Climática de México, and Arayara:
Despite promising momentum, the world’s operating coal power capacity has grown 11% since 2015 and global coal use and coal capacity reached an all time high in 2023. The global coal fleet grew by 48.4 gigawatts (GW), or 2%, in 2023 to a total of 2,130 GW, with China driving two-thirds of additions. Outside of China, the coal fleet also saw a small 4.7 GW uptick for the first time since 2019. Although new retirement plans and phaseout commitments continued to emerge, less coal capacity was retired in 2023 than in any other single year in more than a decade. Globally, 69.5 GW of capacity came online while 21.1 GW was retired, resulting in a net annual increase of 48.4 GW, the highest since 2016, bringing the global total capacity to 2,130 GW. China’s 70.2 GW of new construction starts in 2023 represents 19x more than the rest of the world’s 3.7 GW and is the country’s highest annual capacity breaking ground since 2015. Outside of China and India, total proposed coal capacity is at its lowest since data collection began in 2015.
What do Americans want to know about climate change?, Ballew et al., Yale University and George Mason University:
In this analysis, the authors investigated how the questions people would ask an expert vary across different subgroups, including demographic and political groups and Global Warming’s Six Americas. The Six Americas framework categorizes people into six distinct audiences based on their opinions about climate change, ranging from the Alarmed (who are the most worried and supportive of action) to the Dismissive (who do not believe climate change is happening or human caused and are often opposed to action). Americans are most interested in learning about solutions to global warming (44%), followed by evidence that it is happening (20%) or information about the causes (18%). Fewer Americans (11%) would ask first about the impacts of global warming. The topics people would ask about differ across demographic and political groups.
143 articles in 61 journals by 832 contributing authors
Observations of climate change, effects
Assessment of climate variability and trends in different physiographic zones of North Western Himalayas, Shafiq et al., Theoretical and Applied Climatology 10.1007/s00704-024-04961-3
InSAR-measured permafrost degradation of palsa peatlands in northern Sweden, Valman et al., The Cryosphere Open Access pdf 10.5194/tc-18-1773-2024
The risk of concurrent heatwaves and extreme sea levels along the global coastline is increasing, Zhou & Wang, Communications Earth & Environment Open Access pdf 10.1038/s43247-024-01274-1
Read more...
0 comments
Posted on 17 April 2024 by Guest Author
This is a re-post from Andrew Dessler at the Climate Brink blog
In 2023, the Earth reached temperature levels unprecedented in modern times. Given that, it’s reasonable to ask: What’s going on? There’s been lots of discussions by scientists about whether this is just the normal progression of global warming or if something we don’t understand is happening — in other words, we’ve broken the climate.
In this post, I compare the observational temperature record to an ensemble of state-of-the-art CMIP6 models to see exactly how unusual 2023 was. It turns out that 2023 is just not that unusual when compared to the model ensemble.
Let’s start with observations. I’m going to be using the Berkeley Earth global average temperature data. In that data set, 2023 was a record-breaking 1.54C above the 1850-1900 average temperature. This temperature exceeded the previous record (set in 2016) by 0.17C.
Beating the previous record by 0.17C is huge: if we look at the temperature observations since 1970, the margin by which records were broken averaged 0.07C, with a median of 0.05C. And no record in the last 50 years had a margin larger than 0.17C.
What does the climate model ensemble show? I have analyzed 38 CMIP6 models over the period 1970-2030 driven by historical and SSP4.5 forcing. Here is a plot of the biggest margin for a record year vs. the year that record occurred:
Read more...
5 comments
Posted on 16 April 2024 by John Mason, BaerbelW
On February 14, 2023 we announced our Rebuttal Update Project. This included an ask for feedback about the added "At a glance" section in the updated basic rebuttal versions. This weekly blog post series highlights this new section of one of the updated basic rebuttal versions and serves as a "bump" for our ask. This week features "Is the science settled?". More will follow in the upcoming weeks. Please follow the Further Reading link at the bottom to read the full rebuttal and to join the discussion in the comment thread there.
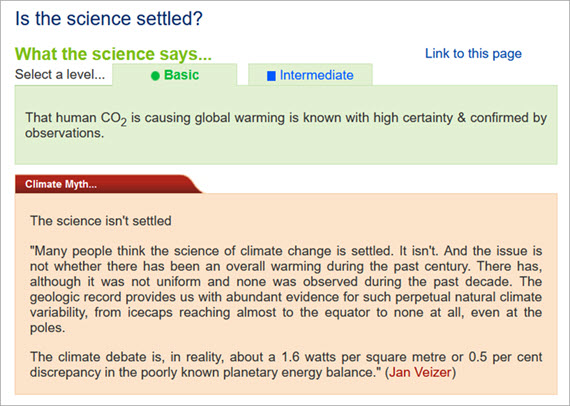
At a glance
Science, in all of its aspects, is an ongoing matter. It is based on making progress. For a familiar example, everyone knows that the dinosaurs died out suddenly, 65 million years ago. They vanished from the fossil record. The science is settled on that. But how and why that happened is still a really interesting research area. We know a monster asteroid smacked into the planet at roughly the same time. But we cannot yet conclude with 100% certainty that the asteroid bore sole responsibility for everything that followed.
With regard to climate science, the basis of the greenhouse effect was demonstrated in the 19th Century. The effect on global temperature through doubling the concentration of atmospheric CO2 had been calculated before 1900 and was not far off modern estimates. Raising global temperature causes Earth's climatic belts to shift polewards. Higher temperatures reduce the amount of land-ice on the planet. That in turn causes sea levels to rise. These are such simple basic physical principles that we can confidently state the science is settled on all of them.
Where the science is less settled is in the fine detail. For example, if you live in a coastal town at a low elevation, you would obviously like to know when it is likely to be affected by rising seas. But that's difficult.
Difficult because changes in sea levels, variations in the sizes of tides and weather patterns are all factors that operate independently of each other and on different time-scales. We may well know that a big storm-surge hitting the coast at high water on a spring tide is the worst-case scenario, but we don't know exactly when that might happen in the decades ahead. Too many variables.
Such minute but important details are where the science isn't settled. Yes we know that if we carry on spewing out tens of billions of tonnes of CO2 every year, things will get really bad. Where and when is the tricky bit. But if climate change was a deadly pathogen, for which there was a vaccine, most of us would get that jab.
In passing, the myth in the box above illustrates a key tactic of misinformation-practitioners, to mix up a whole bunch of talking-points into a rhetorical torrent. The classic example of the practice is the 'Gish-gallop'.
The term Gish-gallop was coined in reference to a leading American member of the creationist movement, Duane Gish (1921-2013). Gish was well-known for relishing fiery public debates with evolutionists. He perfected the method of presenting multiple arguments in a rapid-fire but scattergun manner so that they are impossible to answer in a structured form. It's the opposite of scientific discussion. The Gish-galloper appears to the viewers or listeners to be winning the debate. 'Appears' is the keyword here, though. If you can recognise a Gish-gallop developing, you can make your own mind up quickly.
Please use this form to provide feedback about this new "At a glance" section. Read a more technical version below or dig deeper via the tabs above!
Read more...
0 comments
Posted on 15 April 2024 by dana1981
This is a re-post from Yale Climate Connections
The June general election in Mexico could mark a turning point in ensuring that the country’s climate policies better reflect the desire of its citizens to address the climate crisis, with both leading presidential candidates expressing support for renewable energy.
Mexico is the 10th-most populated country with the 15th-largest economy and is also the 11th-most climate-polluting country in the world.
In international surveys conducted in 2022 and 2023, Mexico had one of the highest percentages of citizens worried about human-caused climate change at 92%, compared to just 63% of Americans.* And 88% of Mexican respondents reported that they consider climate change an important issue that their country should address as a priority, compared to just 58% of Americans. This concern may reflect that Mexico is highly vulnerable to droughts, heat waves, hurricanes, flooding, and food and water insecurity worsened by climate change.
But the Mexican government’s climate policy record has been inconsistent. At times, the country’s leaders have taken steps toward reducing its share of climate pollution, but its current and outgoing president Andrés Manuel López Obrador, commonly known by his initials AMLO, has tended to prioritize domestic fossil fuel resources over low-carbon alternatives.
Mexico will hold its next general election on June 2, 2024. Voters will select the next president, who will succeed AMLO in October of this year.
Read more...
1 comments
Posted on 14 April 2024 by BaerbelW, Doug Bostrom, John Hartz
A listing of 31 news and opinion articles we found interesting and shared on social media during the past week: Sun, April 7, 2024 thru Sat, April 13, 2024.
Story of the week
Our story of the week is about adults in the room setting terms and conditions of good behavior. Here it's not parents telling children what to do but instead the widely adopted, mutually agreed system of coercive behavior modification we call "rule of law." Legislators providing courts of justice with laws to apply are how we formalize overcoming widely harmful selfish actions— or negligent inactions. These are our proxy adults telling us what we can't do or must do— our aspirations for better nature given teeth. We could wish that we were all so perfect as to never need grownup guidance of a kind leading to fines or imprisonment, but if anything can serve to illustrate how this isn't realistic it's our failure to confront accountability for fossil fuels and what happens when nobody is willing to say "no."
Belatedly, in step our appointed adults— in this case the European Court of Human Rights (ECtHR). Three articles we shared this week covered an important decision handed down by this court with respect to Verein KlimaSeniorinnen Schweiz and Others v. Switzerland. The court finds that Switzerland is negligent in pursuing climate mitigation plans and hence is harming human rights protected by Article 8 of the European Convention on Human Rights. This is an extremely important precedent, an overdue acknowledgement of human rights being climate-connected. But the outcome is all the more remarkable given the ECtHR's previous agility in reasoning its way to tossing applicants' cases centered on human rights as they pertain to climate matters. Notably, the court has also just rendered unfavorable judgments on two other climate-connected cases, in ways that sometimes seemed to defy common sense. The Sabin Center for Climate Change Law provides a short article providing context helping us to understand this single verdict as a sea change, in its introduction to a symposium on the topic.
Stories we promoted this week, by publication date:
Before April 7
- Scientists confirm record highs for three most important heat-trapping gases, The Guardian, Oliver Milman. Global concentrations of carbon dioxide, methane and nitrous oxide climbed to unseen levels in 2023, underlining climate crisis
- ‘Simply mind-boggling’: world record temperature jump in Antarctic raises fears of catastrophe, Environment, The Observer/The Gurdian, Robin McKie. "An unprecedented leap of 38.5C in the coldest place on Earth is a harbinger of a disaster for humans and the local ecosystem"
- Climate Adam: Is Global Warming Speeding Up?, ClimateAdam on Youtube, Adam Levy.
- Skeptical Science New Research for Week #14 2024, Skeptical Science, Doug Bostrom & Marc Kodack. Skeptical Science's weekly compendium of climate research.
- The Power List: Sophia Mathur, MacLean's, Katie Underwood. Governments are dragging their heels on emissions cuts. In Ontario, this 17-year-old activist is suing over it. She’s our No. 1 climate crusader.
April 7
- 2024 SkS Weekly Climate Change & Global Warming News Roundup #14, Skeptical Science, Baerbel Winkler, Doug Bostrom and John Hartz. Another batch of 34 articles shared in the week from March 31 to April 6, 2024
- Zambians Feel the Personal Consequences of Climate Change-and Dream of a Sustainable Future, Inside Climate News, Georgina Gustin. Lede: Zambia, like its southern African neighbors, depends on rain for its food, energy and economy. But it hasn’t gotten enough this year, and likely won’t in the future, a victim of a climate crisis it didn’t cause.
- Top Europe rights court to issue landmark climate verdicts, Phys.org, Antoine Pollez (AfP).
Read more...
1 comments
Posted on 13 April 2024 by SkS-Team
Skeptical Science is partnering with Gigafact to produce fact briefs — bite-sized fact checks of trending claims. This fact brief was written by Sue Bin Park in collaboration with members from our Skeptical Science team. You can submit claims you think need checking via the tipline.
Did global warming stop in 1998?
While 1998 was an abnormally warm year, annual average temperatures have trended steadily upward in the decades since.
As a strong El Nino year, 1998 featured a significant spike in global temperatures. El Nino is the warm phase of a cyclic climatic pattern where sea temperatures in parts of the Pacific swing higher or lower than average. The 1998 El Nino stood out above the rising temperature trendline that is due to manmade global warming.
However, the long-term upward trend in globally-averaged temperatures has continued. In the past quarter century, the top ten hottest years on record have all occurred since 2010.
Go to full rebuttal on Skeptical Science or to the fact brief on Gigafact
This fact brief is responsive to conversations such as this one.
Sources
ReliefWeb El Niño - 1998 Global Surface Temperature: Highest by a Wide Margin
Royal Meterological Society Coverage bias in the HadCRUT4 temperature series and its impact on recent temperature trends
NASA Global Temperature
Read more...
0 comments
|
|


The Consensus Project Website
THE ESCALATOR

(free to republish)
|


 Arguments